

A 50-year-old male with past medical history of hypertension, hyperlipidemia, type 2 diabetes mellitus, and alcohol use disorder presents to the ED with chest pain. He states that his chest pain started around 6:30 PM today (it is currently 9:10 PM) and that he felt dizzy and diaphoretic upon onset of symptoms. He denies fever, chills, SOB, abdominal pain, nausea, vomiting, change in bowel habits, dysuria or any other complaints. An ECG was obtained on arrival (Figure 1).
Interpretation:
Rate: 66 bpm; Rhythm: regular rhythm with p waves before every QRS; Axis: normal axis (I: pos, II: pos., aVF: pos); Intervals: PR: 162, normal; QRS: 107, normal; QTc: 400, normal; P-Waves: present and associated with every QRS, QRS Complex: normal; ST Segment/T-waves: prominent I/aVL ST depression and deep TWI with STE III and less so in aVF and associated hyperacute T-waves
The treating team in the ED was concerned about the initial history and ECG, but initially held off on activating a STEMI pending a repeat ECG, which was obtained 10 minutes later (Figure 2):

Figure 2. Repeat ECG.
Interpretation:
Rate: 67 bpm; Rhythm: regular rhythm with p waves before every QRS; Axis: normal axis (I: pos, II: pos., aVF: pos); Intervals: PR: 157, normal; QRS: 108, normal; QTc: 396, normal; P-Waves: present and associated with every QRS, QRS Complex: normal; ST Segment/T-waves: STE in II, III, aVF with STD in I and aVL. Early R wave progression in V2-3
The repeat ECG was concerning for inferior STEMI, and a STEMI activation was initiated within 20 minutes of initial ECG. Cardiology agreed with the interpretation. Point-of-care TTE demonstrated an ejection fraction of 50-55% with hypokinesia in the mid and basal inferior and inferoseptal walls. Initial troponin was 0.034.
Catheterization Report: Acute inferior STEMI with 100% acute thrombotic stenosis of the distal RCA/rPLS/rPDA bifurcation.
An ECG was done post-catheterization (Figure 3):
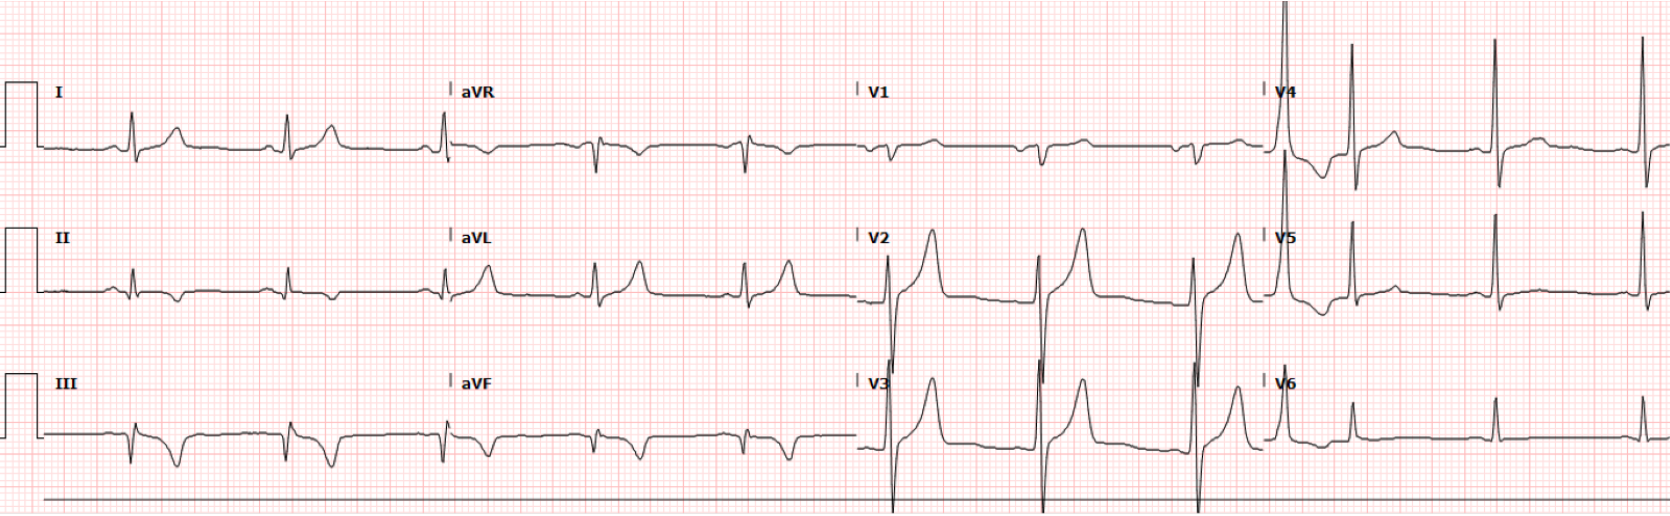
Figure 3. Post-cath ECG.
Interpretation:
Rate: 71 bpm; Rhythm: regular rhythm with p waves before every QRS; Axis: left axis (I: pos, II: pos., aVF: neg); Intervals: PR: 150, normal; QRS: 94, short; QTc: 402, normal; P-Waves: present and associated with every QRS, QRS Complex: normal; ST Segment/T-waves: tall, peaked T-waves in V2-3, ST elevation in V2-3. TWI in leads II, III, aVF
Discussion:
The initial ECG showed prominent I/aVL ST depression and deep T-wave inversions with ST elevation in leads III and aVF, and the repeat ECG showed a clear inferior STEMI. It is very common for ST depression in I/aVL to be the predominant finding in some inferior occlusive myocardial infarctions (OMI), oftentimes with signs of reciprocal changes inferiorly.
Quick Review of ECG changes to detect OMI:
Hyperacute or small hyperacute T-waves
Pathologic Q-waves with subtle STE which cannot be attributed to old MI
Terminal QRS Distortion that does not extend to baseline, with absence of both a J-wave and an S-wave
Reciprocal STD and/or T-wave Inversion
Subtle STE not Meeting Criteria
STD Maximal in V2 – V4 Indicative of Posterior OMI
Any STE in Inferior Leads with any STD/T-Wave Inversion in aVL (1)
Pro Tip: If it isn’t a clear STEMI and you aren’t sure if it is an OMI, just repeat the ECG in 10-15 minutes, like was done in this case, to assess for any dynamic changes.
The post-catheterization ECG (Figure 3) shows classic reperfusion changes. The inferior myocardium, supplied by the now patent RCA, is now reperfused after stent placement (Figure 4). Thus, we see typical reperfusion changes, which includes prominent T-wave inversions. These T-wave inversions are also seen in the posterior myocardium. However, leads V2-3 “look” at the anterior myocardium. Thus instead of seeing deep T-wave inversion we see the opposite: peaked T-waves. We also see the re-establishment of physiologic ST elevation in V2-3. New or deepening TWI in the leads where the STE was noted can indicate myocardial reperfusion and is generally a favorable prognostic sign. In the days of thrombolytics, T-wave inversions were used as a sign to prove that the thrombolytics worked (2)!
It is important to know about these ECG changes in the ED. If you have a patient with anginal symptoms that are now improved and their ECG shows signs of reperfusion, then there is a possibility that they had an occluded coronary artery that spontaneously reperfused. Do not use the HEART score or any other risk stratification tool for those patients! They need admission and close monitoring for signs of re-occlusion. In the right context, they will require a more urgent Cardiology consultation for possible catheterization.

Figure 4. Coronary circulation.
ECG Findings Post-Thrombolytic Therapy (2, 3):
ST-Segment Changes: A key marker of reperfusion is the reduction or resolution of ST segment elevation. This should be observed within 60-90 minutes after thrombolytic administration.
Reperfusion Arrhythmias: The presence of accelerated idioventricular rhythm (AIVR), a rhythm typically ranging from 50-120 bpm, is a positive sign of reperfusion. It often occurs transiently and does not usually require treatment unless it is associated with hemodynamic instability. AIVR consists of a regular rhythm with a rate typically 50-120 bpm. There are three or more ventricular complexes, the QRS duration is over 120ms, and there are fusion and capture beats.
T-Wave Inversions: New or deepening T-wave inversions in the leads where ST elevation was noted can indicate myocardial reperfusion and are generally a favorable prognostic sign.
Authored by Michael Hohl, MD; Taylor Wahrenbrock, MD; and Ari Edelheit, MD.
References:
Salim R. "Upping Our ECG Game: OMI vs STEMI", REBEL EM blog, May 10, 2021. Available at: https://rebelem.com/upping-our-ecg-game-omi-vs-stemi/
Post-Thrombolytic Reperfusion ECG Findings ECG STAT. https://ecgweekly.com/ecgstat/post-lytic-reperfusion/
LITFL Accelerated Idioventricular Rhythm (AIVR) Overview. Accelerated Idioventricular Rhythm (AIVR) • LITFL • ECG Library