
Straining The Right Heart
63 yo male with PMH of hypertension and mild case of COVID pneumonia four months prior, presents with one week of dyspnea on exertion and dry cough. He states that he experiences significant dyspnea with simple activities such as putting on his clothes or walking from his bedroom to the bathroom. He denies any chest pain, fevers, or chills.
Initial vitals:
HR: 112 beats/minute
BP: 174/98
RR: 28 breaths/minute
SpO2: 93% on room air
T: 37°C
His ECG is shown below:

Computer interpretation: sinus tachycardia (ventricular rate of 109), low voltage QRS, incomplete right bundle branch block (RBBB), cannot rule out anterior infarct, age undetermined.
Physician interpretation: sinus tachycardia, low voltage QRS, incomplete RBBB, S1Q3T3 pattern, right ventricular (RV) strain pattern. When compared to his previous ECG, deeper S wave in lead I with new T wave inversions in leads III, aVF, and V2-V5, as well as new T wave flattening in lead II. These findings raise concern for acute RV strain.
Why this ECG?
In a patient with acute onset dyspnea on exertion, the above ECG increases our suspicion for conditions that cause pulmonary hypertension, such as a pulmonary embolism (PE).
In a study by Kosuge et al in 2007 [1], the following ECG features were seen in patients with PEs:
Non-specific ST segment and T wave changes, including ST elevation and depression (seen in 50% of patients with PE)
Sinus tachycardia (seen in 44% of patients with PE)
Right ventricular strain pattern (seen in 34% of patients with PE): defined as T wave inversions in the R precordial leads (V1-V4) ± the inferior leads (II, III, and aVF). This pattern is associated with high pulmonary artery pressures.
S1Q3T3 pattern (seen in 20% of patients with PE): defined as a deep S wave in lead I, Q wave in lead III, and an inverted T wave in lead III.
Complete or incomplete RBBB (seen in 18% of patients with PE)
Right axis deviation (seen in 16% of patients with PE)
Right atrial enlargement (seen in 9% of patients with PE): peaked P wave in lead II >2.5mm in height.
Atrial tachyarrhythmias (seen in 8% of patients with PE): eg, Atrial fibrillation/flutter, atrial tachycardia
Dominant R wave in V1: a manifestation of acute RV dilation
Clockwise Rotation: shift of the R/S transition point towards V6 with a persistent S wave in V6 (pulmonary disease pattern).
What is a clockwise rotation? Normally the R wave amplitude increases from V1 to V5. Around V3 or V4 the R wave becomes larger than the S wave and this is called the “transitional zone”. If this transition point occurs after V4, this is called clockwise rotation. It implies rotation of the heart due to right ventricular dilatation [2].
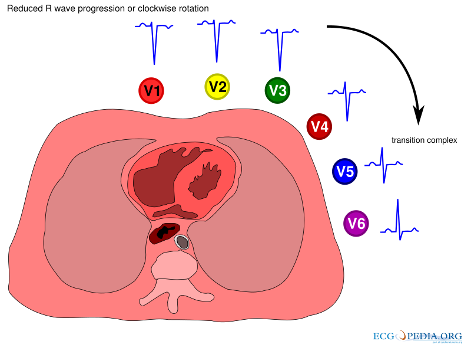
Image from: https://en.ecgpedia.org/wiki/Clockwise_and_Counterclockwise_rotation
Notably, this study showed that among patients with ECGs that demonstrate T wave inversions in the anterior precordial leads (as in our patient), the presence of T wave inversions in both leads III and V1 suggest the diagnosis of acute PE as opposed to acute coronary syndrome (ACS). They found that 88% of these patients with acute PE had T wave inversions in both leads III and V1, vs. just 1% in such patients with ACS [1].
Importantly, simultaneous T wave inversions in the inferior (II, III, aVF) and right precordial leads (V1-4) is reportedly among the most specific findings in favor of PE, with reported specificities of up to 99% in one study [3], [4].
Another study by Co et al in 2017 [5] demonstrated that new T wave inversions and flattening, commonly in the inferior leads, were the most common changes found in patients with PE, occurring in 34.4% and 29.5% of patients in their study, respectively. A new sinus tachycardia occurred in only 27.3% of cases, and 24.1% of patients had no new ECG changes noted, demonstrating the difficulty of making this diagnosis. Notably, the S1Q3T3 pattern was only seen in 4% of patients, highlighting the poor sensitivity and specificity of this finding.
In our patient, his ECG demonstrated:
A new sinus tachycardia
A new incomplete RBBB
A new RV strain pattern demonstrated by T wave inversions in leads V1-V5, as well as in leads III and aVF (and T wave flattening in lead II).
A new S1Q3T3 pattern
A new clockwise rotation with a shift in the R/S transition point to V6 as well as a persistent S wave in V6.
Given the acuity of our patients symptoms and new ECG findings, an acute PE was high on our differential diagnosis.
Some other examples of ECGs that show the RV strain pattern:
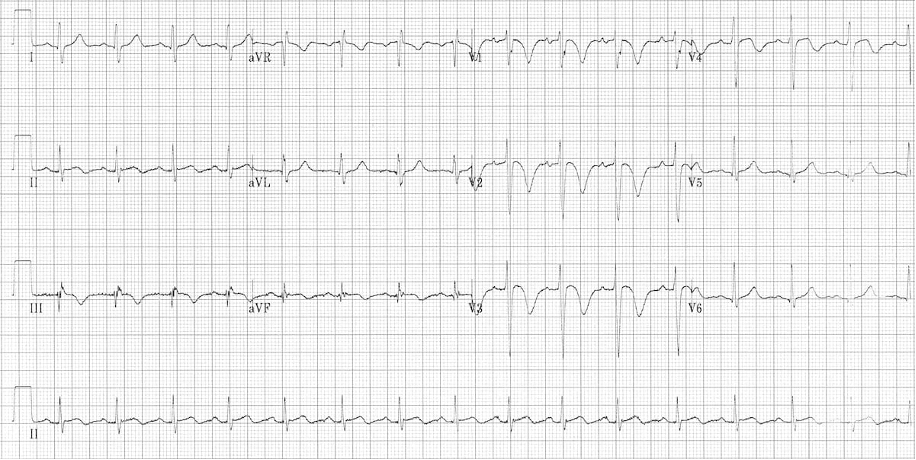
Image from: https://litfl.com/ecg-changes-in-pulmonary-embolism/
This image shows
Sinus tachycardia
S1Q3T3 pattern
RV strain pattern: Simultaneous T-wave inversions in the anterior (V1-4) and inferior leads (II, III, aVF)
This patient was diagnosed with a massive PE
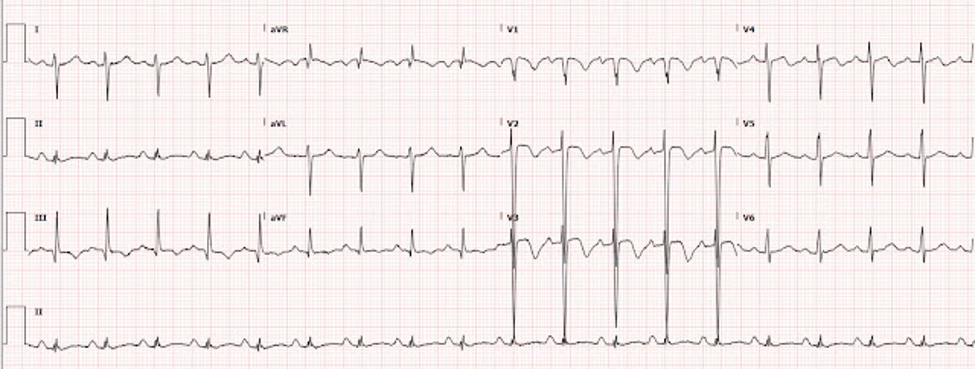
Image from: http://hqmeded-ecg.blogspot.com/search/label/PE%20vs.%20Wellens
This image shows:
Sinus tachycardia
Right axis deviation
S1Q3T3 pattern
RV strain pattern: Simultaneous T-wave inversions in the anterior (V1-4) and inferior leads (III, aVF) with T wave flattening in lead II
This patient was diagnosed with a submassive PE
What happened next?
A bedside echocardiogram was performed, which did not demonstrate any pericardial effusion or obvious RV dilatation. Labs returned, demonstrating a mildly elevated troponin I of 0.08 ng/mL, as well as an elevated BNP of 266 pg/mL. A D-dimer was obtained and was 18,277 ng/mL (normal age-adjusted d-dimer cut off for this patient is <630 ng/mL).
A CT pulmonary angiogram showed extensive bilateral pulmonary emboli involving the right main pulmonary artery and extending into all lobes of the lung bilaterally, without radiographic evidence of right heart strain.
He remained hemodynamically stable and was ultimately diagnosed with a submassive PE. He was treated with low molecular weight heparin (LMWH), and was admitted to the hospital for further care.
The Heart of the Matter:
The RV strain pattern is characterized by T wave inversions in the right precordial leads (V1-V4) +/- the inferior leads (II, III, aVF), and in the right clinical context can be very specific for acute PE.
The S1Q3T3 pattern is a classically taught ECG finding in patients with PE, but its absence should not lower your suspicion of the diagnosis.
The presence of T wave inversions in both leads III and V1 may allow acute PE to be differentiated from ACS in patients with T wave inversions in the precordial leads.
A significant percentage of patients with acute PE may lack any ECG abnormalities.
Written by:
Rayyan Kadi, MD - PGY 4 | Cook County Health
Twitter: @RayyanKadi
Reviewed by:
Robert Feldmen, MD
Department of Emergency Medicine |Cook County Health
For more reading:
https://litfl.com/ecg-changes-in-pulmonary-embolism/
https://litfl.com/right-ventricular-strain-ecg-library/
https://hqmeded-ecg.blogspot.com/search/label/pulmonary%20embolism
http://hqmeded-ecg.blogspot.com/2018/03/a-crashing-patient-with-abnormal-ecg.html
http://hqmeded-ecg.blogspot.com/search/label/PE%20vs.%20Wellens
References:
Kosuge M, Kimura K, Ishikawa T, Ebina T, Hibi K, Kusama I, Nakachi T, Endo M, Komura N, Umemura S. Electrocardiographic differentiation between acute pulmonary embolism and acute coronary syndromes on the basis of negative T waves. Am J Cardiol. 2007 Mar 15;99(6):817-21. doi: 10.1016/j.amjcard.2006.10.043. Epub 2007 Jan 30. PMID: 17350373.
Tahara Y, Mizuno H, Ono A, and Ishikawa K. Evaluation of the electrocardiographic transitional zone by cardiac computed tomography. J Electrocardiol. 1991 Jul;24(3):239-45. doi:10.1016/0022-0736(91)90029-l. PMID:1919383.
Kosuge M, Ebina T, Hibi K, Tsukahara K, Iwahashi N, Gohbara M, Matsuzawa Y, Okada K, Morita S, Umemura S, Kimura K. Differences in negative T waves among acute coronary syndrome, acute pulmonary embolism, and Takotsubo cardiomyopathy. Eur Heart J Acute Cardiovasc Care. 2012 Dec;1(4):349-57. doi: 10.1177/2048872612466790. PMID: 24062927.
Yenigalla S, Kaur N, Abhishek F. Tell-Tale T Waves in Acute Pulmonary Embolism. Chest Journal. 2019. Monday Medical Student/Resident Case Report Posters. Volume 156, Issue 4, Supplement, A768, October 01, 2019. doi: http://dx.doi.org/10.1016/j.chest.2019.08.739
Co I, Eilbert W, Chiganos T. New Electrocardiographic Changes in Patients Diagnosed with Pulmonary Embolism. J Emerg Med. 2017 Mar;52(3):280-285. doi: 10.1016/j.jemermed.2016.09.009. Epub 2016 Oct 11. PMID: 27742402.